New lysis gene discovery
Thousands of phage genomes have been sequenced. Using bioinformatic analysis, our lab has learned that we still don’t know the “hole” story. There are phages that are missing lysis genes. The way we search for lysis genes is limited to our understanding of known lysis proteins. Therefore, phages that are “missing” lysis genes simply have other ways of causing lysis that are very different from what is published so far. We are in the process of identifying new lysis genes and figuring out how they work (See Figure 1). This project is important for more than basic science; perhaps the next lysis protein discovered could be used for medicine to target pathogenic bacteria!
 Figure 1. A phage genome is depicted with grey arrows. We clone out putative lysis genes and test them by complementation.
Projects with space for new team members:
1. The lysis pathway in four dimensions
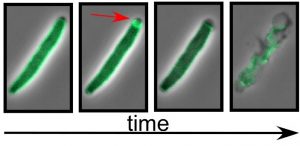
The models for lysis described above have been derived from genetic evidence, which has given us clues toward how lysis proteins rearrange to form holes and disrupt membranes. There is still a lot to learn about three small lysis proteins can destroy a healthy bacterial cell in the matter of seconds. Can we use fluorescence microscopy to monitor what fluorescent-tagged lysis proteins do as they destroy the bacterial cell? An example of this is shown in Figure 1. Using this technique, we are answering such questions as: Where do the lysis proteins accumulate? What is the timeline for each step? How large/how many holes are formed and what is the structure of the membrane holes?
 Figure 2. A lysis protein is tagged with a fluorescent protein. Cells were imaged prior to lysis using phase and fluorescence microscopy. A merger of these micrographs are shown. The arrow indicates a sudden rearrangement in the distribution of the lysis protein in the seconds preceding lysis.
2. Genetic analysis of lysis genes
One could argue phage researchers have quite an advantage here. Genetic analysis requires enough time for the organism you are studying to grow and replicate for generations. We are fortunate that many phages can reproduce so quickly, going from one to a billion viruses in a couple of hours! Furthermore, since lysis genes are essential, we have a tight on/off switch to design selection experiments. We can inactivate a lysis gene by mutagenesis and learn about the functionally important domains within the protein. This is done by analyzing the frequency and nature of the mutations and noticing the “hotspots” that are mutationally sensitive.
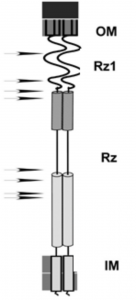
Notice the location of the black arrows to the left of Rz and Rz1 in Figure 3. These are positions where a mutation resulted in a single amino acid change that blocked spanin function. Also notice that they have a pattern: They cluster within the predicted alpha helices of Rz, which we interpret as evidence of the importance of these domains.
 Figure 3. A cartoon of the spanin complex within the cell envelope. The position of the helices in Rz is based on JPred 4 secondary structural predictions. The arrows denote the relative positions of single missense mutations that block spanin function. That is, each one of these single amino acid changes alone in Rz or Rz1 is sufficient to block lysis at the outer membrane disruption step.
As phages propagate through rounds of replication and infection they must copy their DNA. During this process, phages introduce mutations into their genome. This occurs at a rate of around 1/million substitutions per DNA base pair per round of replication. Therefore, if we produce a billion phage that carry a mutation coding for an inactivated lysis gene, there is a high chance that a small population of phages will have randomly acquired a second mutation -at the same place in genome or somewhere else- that corrects the lysis defect. This is called a suppressor mutation. Performing a suppressor screen/selection (AKA suppressor hunt) is a very powerful genetic tool. Suppressor mutations can give us information about the functional connections within domains of a protein and even identify residues involved in protein-protein interaction. Figure 4 below shows a representation of these data.
 Figure 4. A cartoon representation of suppressor hunt data. The red box shows the position of second site mutations that rescued spanin function.
Most suppressor “hunters” seek point-point contact information, e.g. Rz E150 interacts with Rz1 R59. We did not find that here. Instead these data indicated that the spanin complex was able to regain function by introducing destablizing changes into the core of the coiled-coil domain. We interpreted this as resulting in increased flexibility that allows the spanin complex to overcome a block in the conformation changes required to merge membranes (see Figure 5 below).
Figure 5. Model for how the second site suppressor mutations restore spanin function.

