Draw detailed gene maps for your linear phage genome genbank files using Linear Genome Plot. This new tool has flexible options for genome display on a single or multiple lines with coloring feature shapes based on type (gene, regulatory, etc.) or name (such as product). Label source and placement are also set by the user. The output graphic is in .svg format for ease of editing and preparation of publication-quality figures.
In addition to the figure, the tool outputs a report tallying feature types and product names to assist in customizing settings. Genome subsections can also be plotted, which may be useful for prophage genomes.
Here is an example output for Phage Ponderosa on a single line:
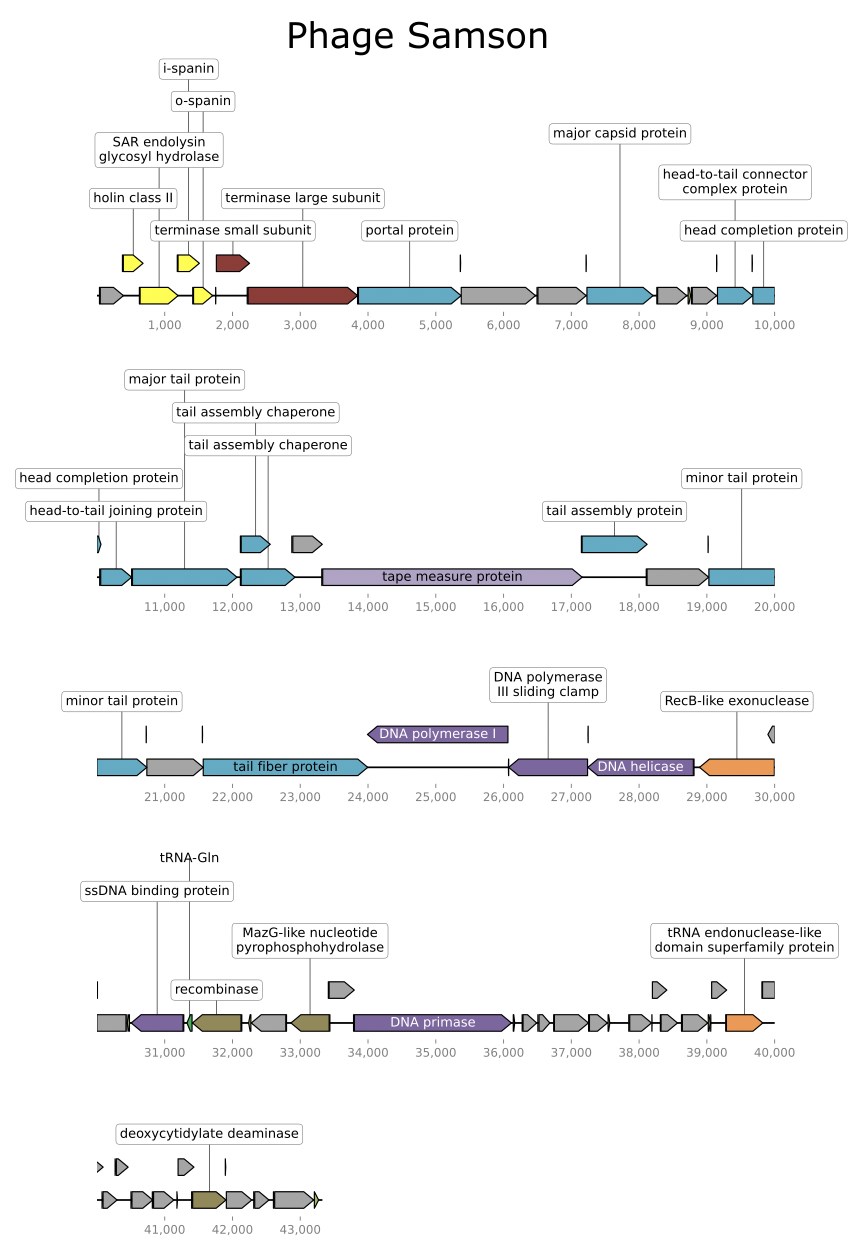
And Samson in a multi-line plot:
Try out the Linear Genome Plot tool to make your next genome map! This tool was adapted from DNA Features Viewer by Curtis Ross and can be found under CPT: Genomic Viz.
Please email the support team if you have any questions!

