Background
Recently we encountered an issue of an underperforming web service. This is a service we want to position as vital to productivity within our organization, that service being OwnCloud. It acts functionally a lot like dropbox, with many features that we really love, all for “free”! (Free not including equipment, maintenance, power, salaries, etc).
As we at the CPT believe in Science and data driven decisions, we added Graphite and StatsD to our monitoring VM. By doing this, we can have actual data to say “this change improved performance” and “this change hurt performance”. This sort of data lets us be intelligent about our optimisations and time management.
For those of you not familiar with StatsD and Graphite, StatsD is a frontend to a number of data point logging servers, one of which is Graphite. Both provide an incredibly easy APIs for sending data, some nice sugar on top of this to make developer life easy, and then a lovely web interface for visualization of your data. StatsD also has the ability to track more than simple numerical values, and provides a richer data API, removing some of the burden and overhead from the developer. With graphite, you may have to track data values over time, keep a history of what you sent, generate timestamps, etc. With StatsD there are several
There are many nice libraries for working with StatsD/Graphite, but as an example of how trivial it is, the following code with add a statistic to your graphite database:
# StatsD

echo "foo:1|c" | nc 127.0.0.1 8125

# Graphite

echo "foo 1 `date +%s`" | nc 127.0.0.1 2003;
With the libraries, this data processing is even easier!
Capturing Data
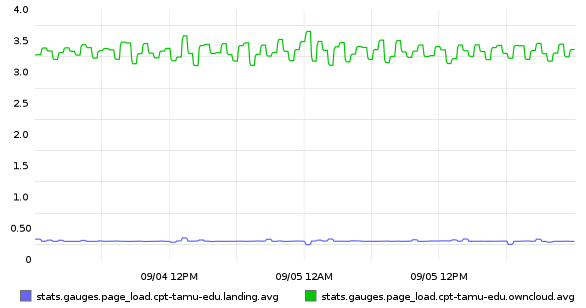
As soon as I scheduled a maintenance window for OwnCloud on our servers, I wrote up a simple python script which makes use of Boom to send some load to a web server. It let us push data to our monitoring VM, and we started logging.

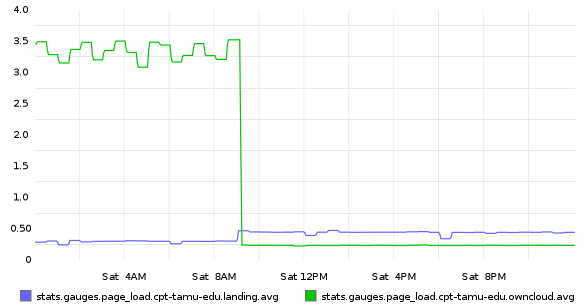
During the maintenance window it was determined that the database connection was the sole source of the performance issue, postgresql socket vs TCP connection. By switching to a socket we saw a dramatic decrease in page rendering times:

Conclusion
Logging with StatsD (for real-time data) and directly through Graphite (for historical data) is absolutely trivial, and should be used anywhere simple metrics are needed to track usage, timings, etc. are needed.
