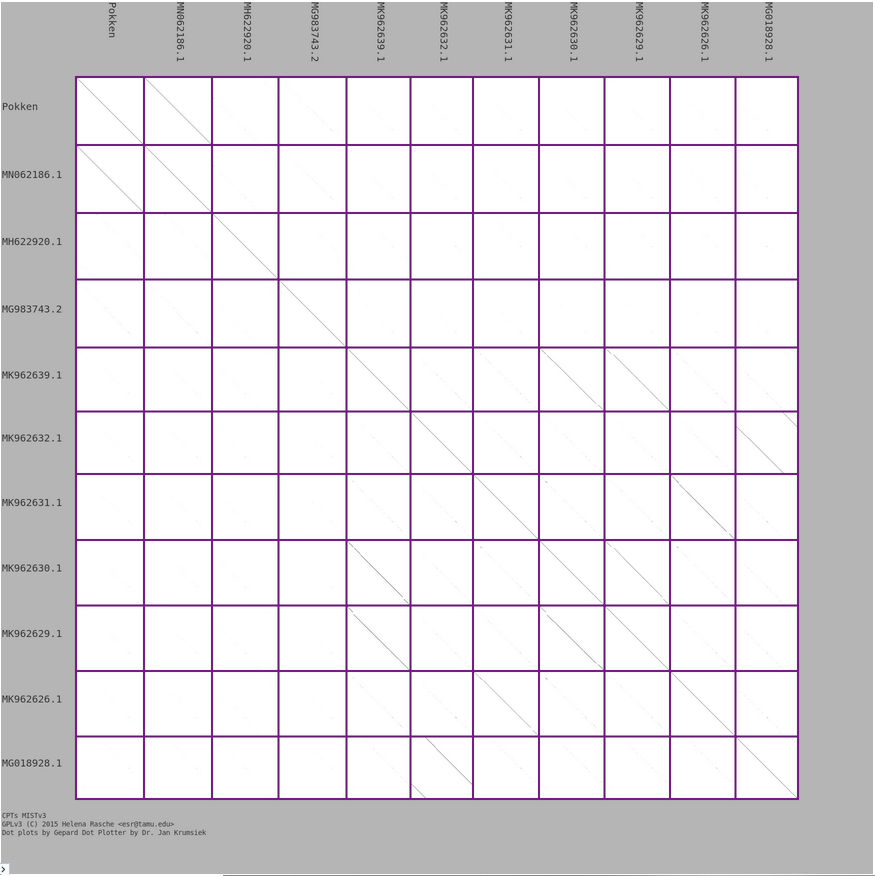
Do you want to compare a large number of phage genomes by dot plot? In the Comparative Genomics workflow, we regularly do genome-wide nucleotide comparisons between 5-10 or more genomes. The dot plot generated by MIST is a primary output from that analysis. Some improvements to labeling placement have been made to optimize readability when comparing a large number of genomes.

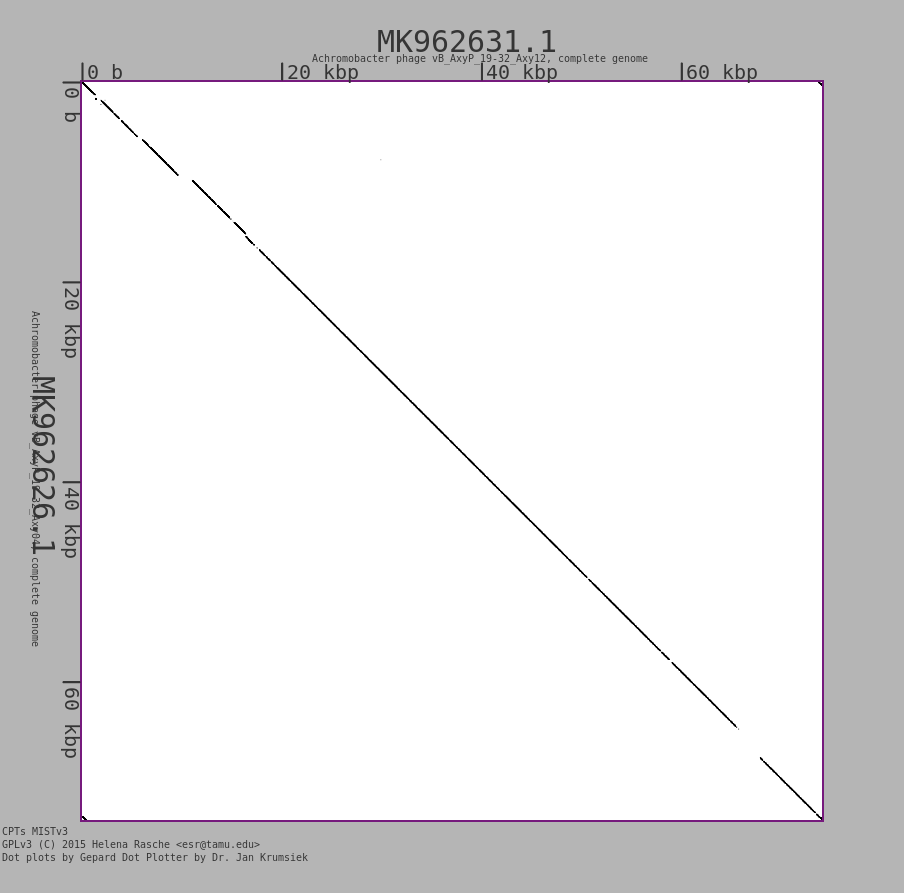
Pro tip: each 1-on-1 comparison can be enlarged by clicking on it!

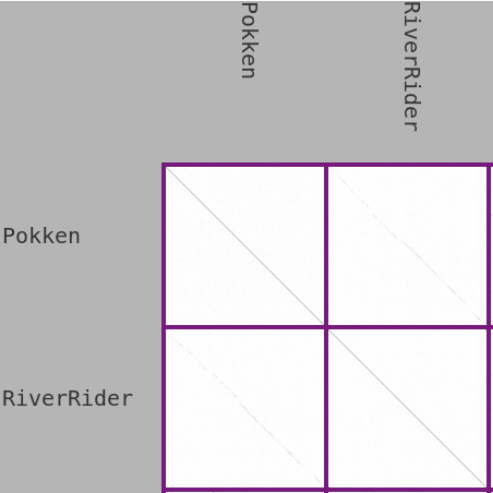
Additionally, a new standalone tool called Excel or CSV to MultiFASTA MIST Preparation has been added that can replace accessions with custom (or shortened) phage names for a viewer friendly version of the output. Detailed instructions for running the tool are in the help text at runtime.

The next time you need to generate a visual dot plot comparison between genomes, look for MIST. Originally developed by Helena Rasche from Gepard, the MIST v3 tool and the name replacing tool can be found in the Galaxy Tools bar under CPT: Comparative Genomics. Please email the support team if you have any questions!
