1. Introduction to Galaxy
1.1. Introduction
Galaxy is a platform for doing reproducible bioinformatics research. It provides a friendly interface to a vast number of complex command line tools, and it encourages consistent science by using identical software and interfaces across all Galaxy instances.
At the CPT we depend on Galaxy for all of our computer-based analysis. We can launch long-running jobs and return to our lab work, while Galaxy keeps track of the progress of our analysis.
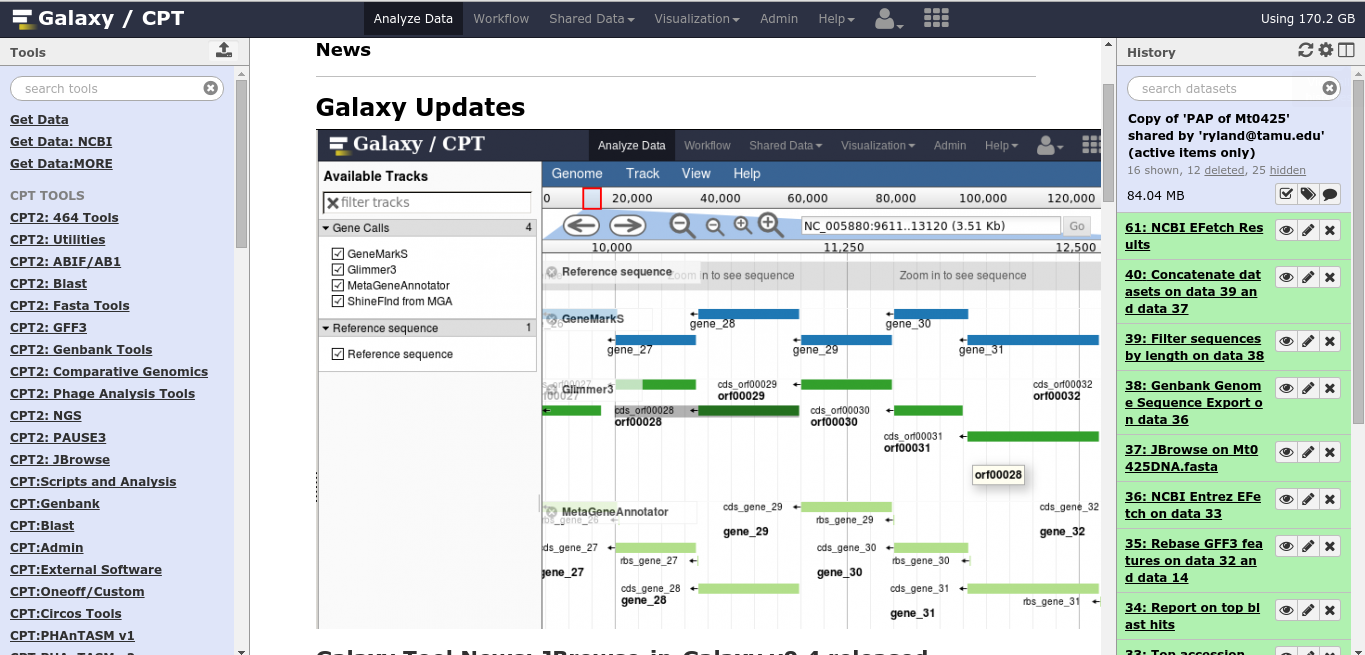
Fig. 1.1 Main Galaxy View
The Galaxy interface consists of three panels. On the left are your tools, in the center you’ll do your analysis and view the results, and on the right is your history.
Note: if you ever find yourself lost in Galaxy, you can always click Analyze Data on the big blue bar at the top, and it’ll take you home.
1.2. Tools
1.2.1. What is a Galaxy tool?
A tool is something that generates or transforms data. In Galaxy, tools are simple interfaces to the complex software behind them. Some examples of tools would be a Gene Caller, which reads your genome and returns a list of gene locations, or Blast, which would search your protein sequences against a database.
1.2.2. How do I upload data?
Nearly all Galaxy tools process input files and produce output files. You may be wondering how to upload your data as input.
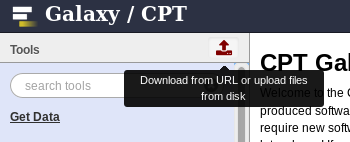
Fig. 1.2 Upload
This button will bring up your upload menu and allow you to import data into Galaxy.
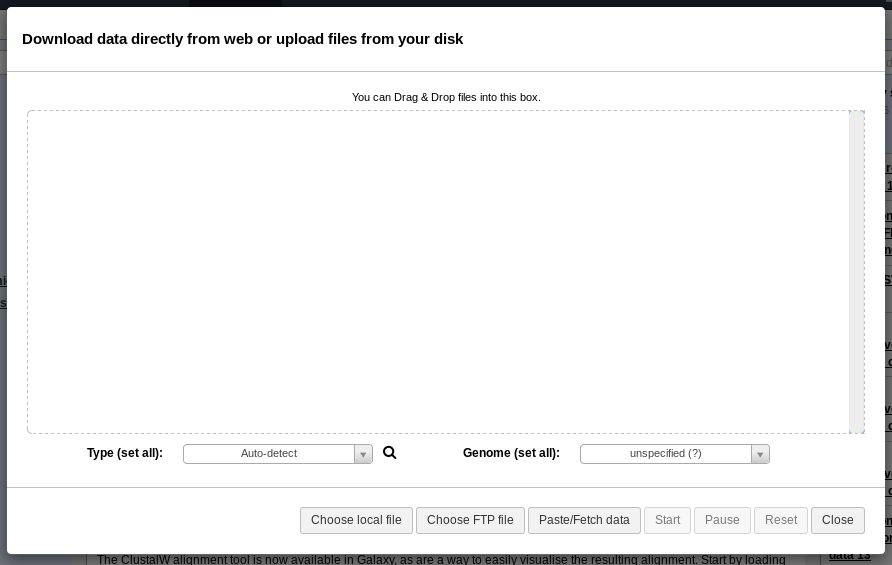
Fig. 1.3 Upload Window
You can drag and drop files to upload them, or use the Choose Local File button in the bottom menu.
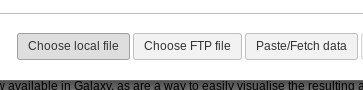
Fig. 1.4 Upload Menu
There are a couple other options for advanced users:
- Choose FTP file allows you to select a file you’ve uploaded via FTP. For files >2GB, this is required.
- Paste/Fetch data allows you to paste in a bit of text or a URL. Galaxy will import that into your history panel on the right.
Once the file has been detected by Galaxy, you’ll see it pop up in the upload window:
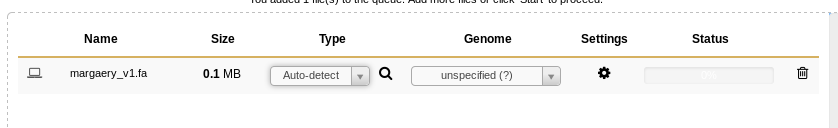
Fig. 1.5 Uploading File
You can set the file type if Galaxy doesn’t detect it properly, but that is a rare case, and before overriding Galaxy you should double check that your file is formatted properly.
When you’ve selected all the files you wish to upload, click Start in the bottom right of the upload menu.

Fig. 1.6 Starting Upload
The dataset will indicate to you that it is uploaded in the upload window,
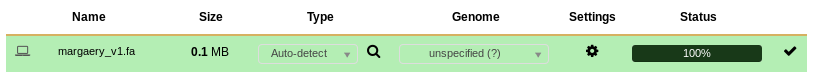
Fig. 1.7 Uploading...
at which time you can close that window with Escape or the Close button in the bottom right.
The dataset will turn yellow
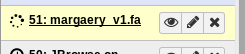
Fig. 1.8 Processing an upload
And then green when it is ready.
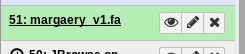
Fig. 1.9 Finished upload
1.2.3. Choosing a Tool
You may search for tools at the top of the tool panel. Alternatively, clicking on a tool group will reveal tools of a certain type which you can choose from. Be sure to read the tool’s help text at the bottom. It may give you very important information regarding running the tool.
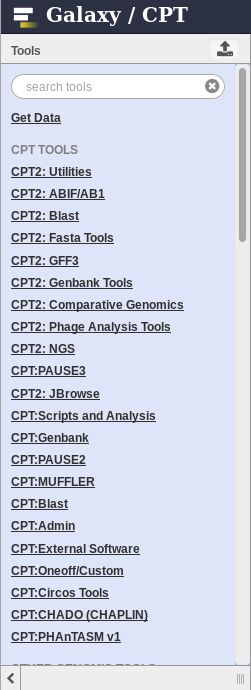
Fig. 1.10 These are groups of tools you can run in Galaxy.
1.2.4. Configuring and Executing a Tool
Next, review the options in the tool interface. Keep in mind that many options are set to default values. You may use your uploaded files or other datasets in your history (more on this later) as inputs, like the Fasta sequence ‘esr.phi29.1’ shown below.
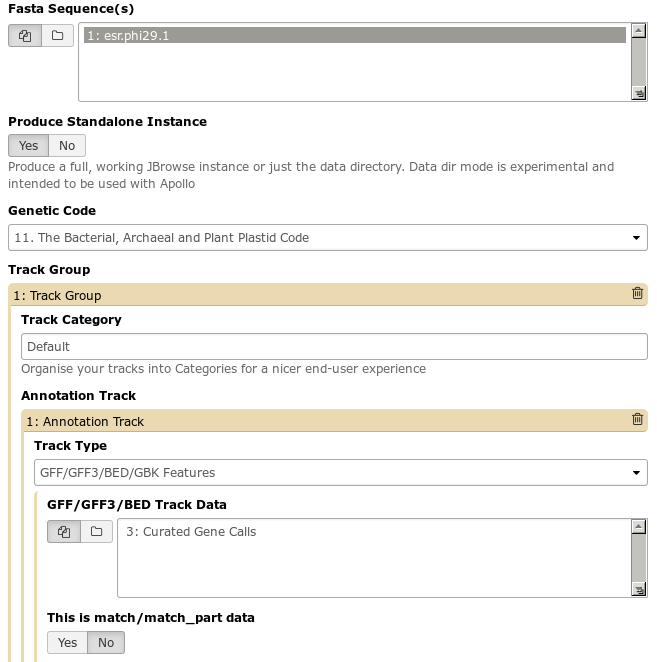
Fig. 1.11 This Galaxy tool has a large number of options. Many tools are highly configurable to meet the needs of a wide variety of end users.
When you’ve finished configuring a tool, and execute it, it will show up as a set of output files in the history on the right.
1.3. Histories
Histories are used to separate out your analyses and help you keep track of what tools you have run. All of your analyses will be stored in your histories.
1.3.1. Datasets
Each numbered entry within a history is called a “dataset”. Tool outputs and data uploads appear as datasets in your history.
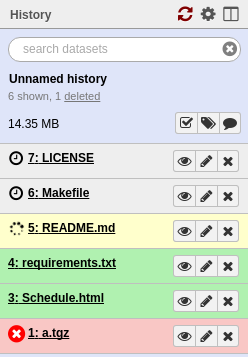
Fig. 1.12 Datasets in a history
Datasets can be one of four colors. Datasets that are grey indicate that a tool has been submitted but has not yet started processing. Yellow datasets mean that the tool is currently running. Datasets appear red or green for completed tools.
Warning
Sometimes tools fail and turn red! If they do, don’t worry–it likely isn’t your fault. Just be sure to click the bug icon and submit a report so we can be made aware of what went wrong.
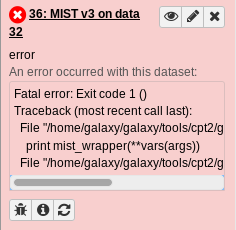
Fig. 1.13 The bug icon is in the bottom left. Please click it and submit a bug report if you see it!
Looking at an individual output dataset, there will be several features that will be of interest to you.
In this example we see dataset #29, which is a table of Start Codon Usages.
Fig. 1.14 An example Dataset
This is the collapsed view of a dataset. Clicking anywhere on the title of the dataset, “Start Codon Usages” will expand to the full view.
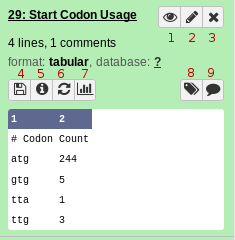
Fig. 1.15 Example Dataset in the expanded view.
Near the top you’ll note the output format is “tabular”. At the bottom of the dataset you can see a preview of this table. Galaxy keeps track of file formats to ensure you only use correctly-formatted data for tools.
The history dataset view is information dense, so we’ll go over the icons and their functions.
- Eyeball views the dataset
- Pencil modifies metadata
- X sends a dataset to the trash. You can recover deleted datasets (see below).
- Save downloads the dataset to your hard-drive. You don’t need to do this, as Galaxy will always have a copy for you.
- Information views details about the tool that was run and how it was configured.
- Rerun is a very commonly used button. This lets you re-run the
tool, with the same parameters configured.
- Need to run the same tool with slightly different parameters? Don’t waste time filling out the tool form; re-run it and tweak those.
- Job failed? Try modifying the tool inputs and re-running it.
- Visualize lets you visualize your dataset in a couple of different ways. We don’t use this very often in the course as it isn’t appropriate to our analysis. However, some of the useful visualizations include: a “charts” visualization that lets you build graphs from your tabular dataset, and an Multiple Sequence Alignment (MSA) visualization plugin in Galaxy which lets you interactively explore MSAs.
- Tags let you annotate datasets with tags. We don’t use this feature.
- Comments let you comment on a dataset to remind yourself why you did it, or maybe to annotate some interesting results you found in the output.
If you delete a dataset accidentally, don’t worry! It isn’t gone permanently.
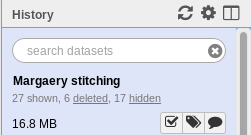
Fig. 1.16 History Header
See the text “6 deleted”? Clicking on the word “deleted” will show you the deleted items in your history.
1.3.2. Naming histories
It’s good practice to title your history based on the analysis you performed. Who knows what “Untitled History” last edited on 2012-02-01 was for? Good names are important! Make sure to create new histories when you start running a new set of analyses. You might make a new history for a task like assembling a genome, annotating a genome, or doing some comparative analysis between phages.
1.3.3. Switching histories
At the top right of your history you’ll see three icons. The refresh icon can be used to refresh your history. The gear icon shows advanced history options. Clicking the “View all histories” button allows you to view and switch between different histories.

Fig. 1.17 History Menu
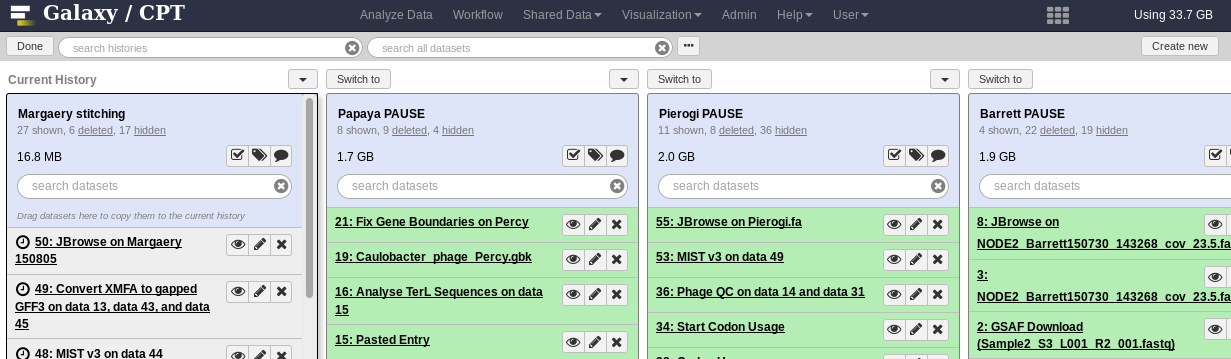
Fig. 1.18 The Galaxy History Switcher
At the top left you’ll see a done button, which will let you exit this view when you’re done. On the left is your current history. To the right of that are your other histories. The switch to button allows you to switch histories. Any new tools you run will be done in this history.
1.4. Workflows
Workflows are merely collections of jobs where some jobs depend on the outputs of other jobs. Say you’re faced with a task like the following:
- Load data from apollo
- Extract all of genes as DNA sequences
- Translate those to protein sequences
- Run those proteins through BlastP
If you did these tasks one by one, you would have to keep track of at least 4 different files. You would also have to wait for each tool to finish before executing the next one.
This is where workflows come in handy:
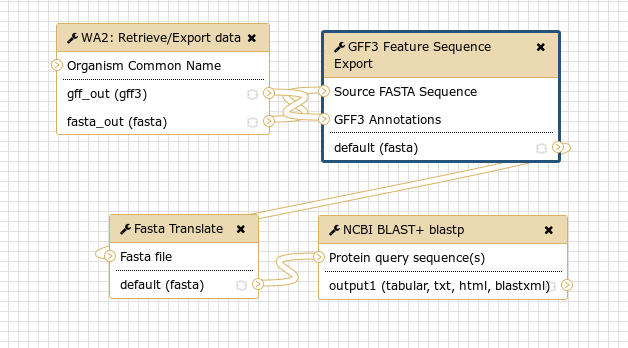
Fig. 1.19 An example workflow encapsulating the four steps from our example above
Workflows solve numerous problems for us:
- Run tools immediately
- The next step can start as soon as data is available; a human does not have to manually start it.
- Discard useless data
- In the above example we probably only cared about the output BLAST results. We don’t care about storing the intermediate files forever.
- Simplified interfaces
- Workflows hide the complexity of many Galaxy tools. You are probably not interested in the fact that we have to extract features from a GFF3 file, and then translate those to protein sequences.
1.4.1. Importing
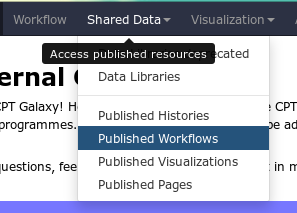
Fig. 1.20 Before you create a new workflow, check the published workflow page. Another user may have created a workflow you can use.
You will often be asked to import workflows. You can do this by going to the Published Workflow page and finding a workflow you’re interested in.
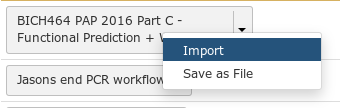
Fig. 1.21 Importing workflows is easy. Just click the down arrow and select “Import”
1.4.2. Running
Workflows which you have imported or created are available under the Workflow menu at the top of Galaxy.
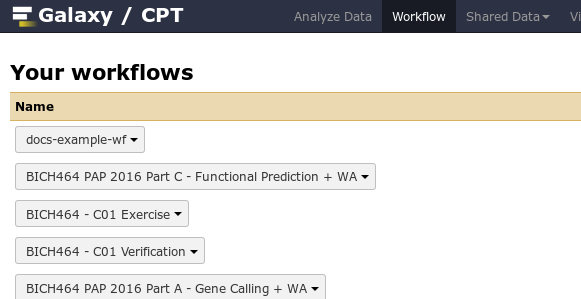
Fig. 1.22 Some of the author’s Galaxy workflows.
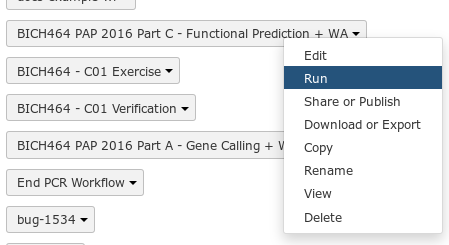
Fig. 1.23 To run a workflow, click the down arrow, and select the Run option
The run workflow interface can be somewhat overwhelming. For the large part, the tools are pre-configured for you. As the course progresses and you start running certain workflows, we’ll cover in detail what each portion of the workflow does.
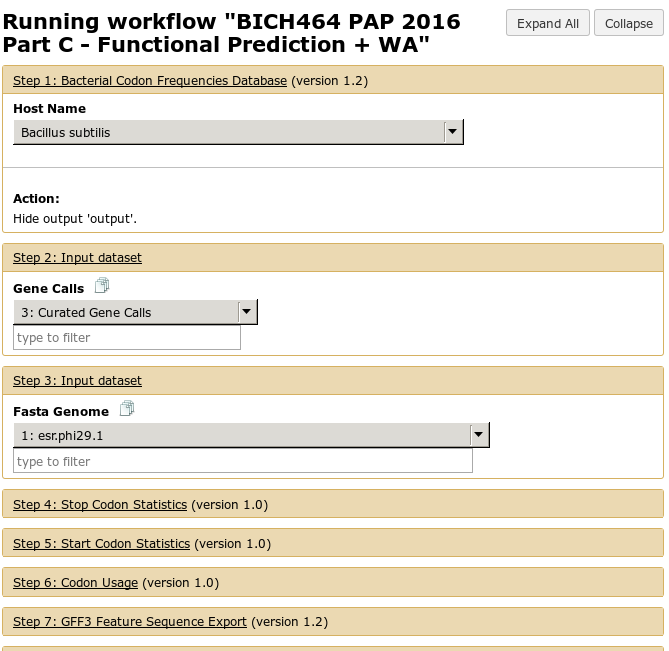
Fig. 1.24 Running a workflow. Some boxes which are automatically expanded may require your attention, the ones which are closed may not require attention
Just like with tools, there is an Execute button at the bottom which will launch the workflow.
1.5. Recap
At this point you should be fairly comfortable with:
- Uploading data
- Running tools
- Tool outputs
- Switching between histories
- Importing workflows
- Running workflows
