7. Phage Comparative Genomics Tools [BICH464 Student Version]
7.1. Prerequisites
Now that you’ve run your functional annotation workflow and gotten a grip on your phage’s genome annotations, we can start looking at how your phage is related to other known phages. The best way to do this is to compare the genome of your phage to sequences that are already deposited in the sequence datbases. We can do this comparison in two ways:
-Compare the entire DNA sequence of your phage to the DNA sequences of other organisms
-Compare the protein sequences of all the genes in your phage to the protein sequences of other organisms
Since you have already run both BLASTp (for proteins) and BLASTn (for nucleotide sequence) as part of the functional workflow, both of these kinds of comparisons have already been made. We will use the BLAST results against the NCBI nr and nt databases for proteins and DNA, respectively. Because these reflect the internationally shared INSDC database, they are the most current and comprehensive.
An overview of how we organize and classify phage genomes is provided in a recent publication. A copy of this publication is also provided in the class Google Drive.
7.2. DNA sequence comparisons
Because the triplet code that encodes protein sequence is degenerate (there are multiple possible triplet codons for most amino acids), DNA sequence can drift and still encode the same protein sequnce by accumulation of silent mutations. This means that DNA sequence that encodes similar proteins can diverge at a relatively high rate, and so DNA sequence comparison is only really useful for organisms that are closely related. For related organisms, DNA sequence can provide good overall comparisons, as this single analysis can demonstrate both conservation of DNA sequence and genome synteny, or the order of genes in the genome. In addition, high conservation of DNA sequence automatically means that proteins encoded by that sequence must also be similar. Once DNA sequence similarity drops below about 30%, it is not very useful for comparisons anymore.
7.3. Protein sequence comparisons
Comparison of organisms by protein sequence is much more sensitive, as there is stronger pressure to conserve a protein sequence for it to retain its function. Phage genome organization is considered to be modular, meaning that individual genes or groups of genes can be shared across otherwise very different phages. For example, in class we discussed phages lambda and P22, which share similar integration and lysogeny genes but different morphogenesis genes, and lambda and T1, which have related morphogenesis genes but different modules for control of replication and lysis. It is not unusual for two phages to be very similar across the genome with only particular genes, such as the phage tail fibers, being different.
7.4. Workflow
Open your Galaxy history that contains the results of the functional workflow.
You will need to “unhide” workflow outputs for the BLASTn analysis. At the top of your history bar, click the “unhide” link. All of the steps from your workflows that were hidden by the system will be visible. Scroll down until you find the dataset called “NT”. This is the output from BLASTn against the NCBI nt databse. Click “Unhide” on this dataset and it will become available for analysis. If you like, you can go back to the top of the History bar and click “Hide hidden” to re-hide the other datasets so they don’t clutter up your view.
Go to Phage comparative genomics (v.1.2) and import by clicking on the green plus sign at the top right of the window.
As before, click Workflow and then right-click > Run the comparative genomoics workflow you just imported.
Select the results of your BLASTp results against the NR database as the input for step 1, the BLASTn results against the NT database (the one that you just unhid) as the input for step 2, and your phage’s FASTA DNA sequence for step 3.
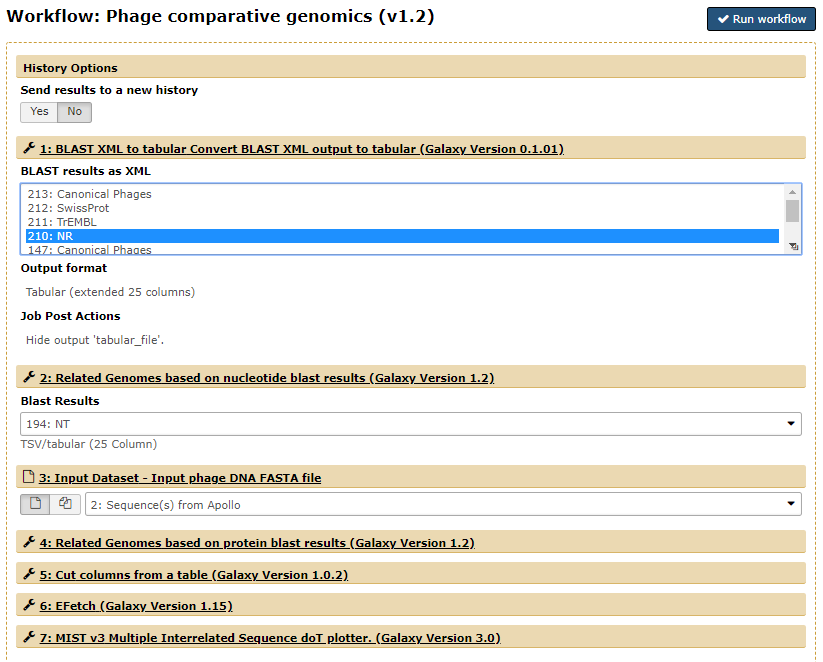
Select the NR BLASTp results for step 1, the NT BLASTn results for step 2, and your phage’s genome for step 3. The dataset numbers will be different for each user.
7.5. Next steps
Now that you have (hopefully) found other phages that are closely related your phage, you can interpret the tool outputs. The workflow should have produced three new datasets in your history: Top BLASTn hits, Top BLASTp hits, and MIST v3.
First look at the Top BLASTn hits data, it will be a small table listing the top 5 most similar organisms to your phage at the DNA level, as determined by BLASTn. If your phage has high similarity at the DNA level to a phage in the database, it is worthwhile to line up these genomes and visualize just how related they are. An easy way to do this is by a comparison method called a dot plot, which will visualize a pairwise comparison of two sequences. The results of such an analysis are shown the the MIST v3 dataset, which will be the results of pairwise dotplots of your phage against the five closest-matching genomes. Phages that are related and syntenic will produce a discrete diagonal line in the dotplot. As DNA sequence similarity is reduced, the line will become fainter and patchier until it is no longer visible.
To determine relationships at the protein level, the Top BLASTp hits dataset contains a table of the top five most related organisms based on the number of similar proteins found by BLASTp. This tool searched through your BLASTp results against the NCBI nr database and retrieved the organisms that matched the highest number of proteins (E < 0.001) in your phage; this number is shown in the last column of the table. Note that this table only shows the top five results. If your phage is part of a large cluster of similar phages (e.g. T4-like phages), then T4 istelf may not appear in the list; five other T4-like phages may be more closely realted to yours, and T4 may only the tenth most-related phage. This doesn’t mean your phage is not T4-like, and it is up to you to determine how your phage relates to other phages.
